
Turn a Google Sheets tracker into an Apple TV dashboard
Half the numbers a team cares about live in a Google Sheets tab somebody updates every Friday: the sales target, the hiring plan, the weekly KPI scorecard. Dance Party reads the ranges you name and turns them into an Apple TV dashboard on the office display, so the sheet stops being something people have to go open.
- Read-only
- OAuth connection
- Personal or workspace connection
Popular Google Sheets dashboards
What teams running Google Sheets put on the screen, and what you would ask DJ Agent to get it.
Monthly target from the planning sheet
For sales and leadership
Targets usually live in a Google Sheet, not the CRM. Read the target cell from the sheet and the actual from HubSpot or Stripe, and the progress bar on the wall uses the number finance agreed to.
- This month's target from a named cell in your planning sheet
- Month-to-date actual, from the same sheet or from a connected CRM
- Percent of target reached
Ask DJ Agent“Show progress to this month's revenue target from Plan!B4 in our 2026 Plan sheet, with the actual from Plan!C4.”
Friday KPI scorecard tab
For the leadership team and the whole office
The weekly scorecard someone already maintains in Sheets is the most agreed-upon set of numbers in the company. Putting that tab on screen makes it the one people quote.
- Four headline KPIs from a Scorecard tab range
- This week against last week, when the sheet has both columns
- Up or down arrows from the change column
Ask DJ Agent“Turn Scorecard!A2:C5 in our Weekly KPIs sheet into four big KPI tiles with the week-over-week change.”
Weekly signups from the growth sheet
For marketing and growth
A column of weekly numbers is easier to read as bars than as cells. Eight weeks on screen shows whether the last campaign moved anything.
- One value per week from a two-column range (week, count)
- The latest week's total as the headline
- The last eight weeks as bars
Ask DJ Agent“Chart the last 8 rows of Signups!A:B from our Growth Tracker sheet as weekly bars, latest week as the headline.”
Rep bookings from the commission sheet
For sales floor
Many teams keep the real commission numbers in a Sheet that sales ops reconciles. A leaderboard built from that sheet is the one reps trust.
- Rep names and bookings from a table on the Commissions tab
- Ranked highest to lowest
- Each rep's share of the top number, as a bar
Ask DJ Agent“Rank reps by bookings using Commissions!A2:B12 in the Q3 Commissions sheet.”
What Dance Party reads from Google Sheets
Dance Party reads only the spreadsheets you pick in Google's file picker. It cannot see the rest of your Drive, and it only reads cell values and sheet structure. It never writes a cell.
Cell values
Google Sheets API docs ↗- One rangeA range like Scorecard!A2:C5, as displayed values or raw numbers.
- Several ranges at onceUp to 20 ranges from one spreadsheet in a single read, such as a target cell and an actuals column.
Spreadsheet structure
Google Sheets API docs ↗- Tabs and titlesThe spreadsheet's name and its tab names, so DJ Agent can find Scorecard or Plan without you spelling out the ID.
Which files
Google Sheets API docs ↗- Picked spreadsheets onlyThe files chosen in Google's picker, including ones in shared drives. Each connection keeps its own list.
How to connect Google Sheets
Before you start
- Any Dance Party member can connect their own Google Sheets. Connecting one for the whole workspace takes an owner or admin.
- Anyone in the workspace can link their own Google account with Connect (just for me). The Company connection, Connect for workspace, is for owners and admins.
- A Google account that can open the spreadsheets you want to show
- If your company uses Google Workspace, its admin may need to allow third-party apps. There is no API key to create.
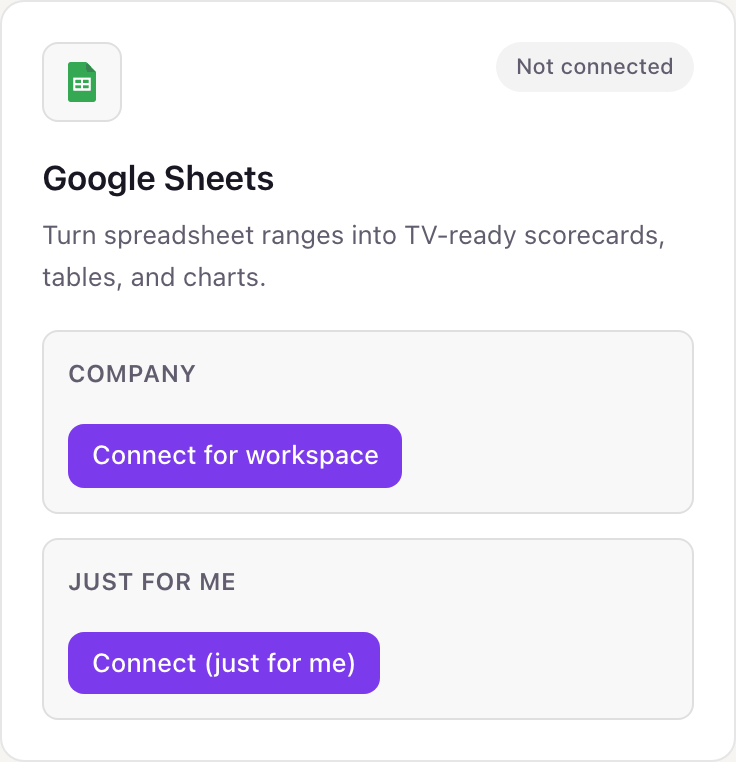
- 1In Dance Party, open Integrations. The Google Sheets card has two boxes: Company, with Connect for workspace, and Just for me, with Connect (just for me). Pick one.
- 2Choose your Google account. Google lists one permission: See, edit, create, and delete only the specific Google Drive files you use with this app. Click Continue.
- 3Back in Dance Party, Google's file picker opens on its own. Tick one or more spreadsheets, from My Drive or a shared drive, and click Select.
- 4The card now reads Choose spreadsheets (2 shared), or however many you picked. Click it any time to add another sheet.
- 5Ask DJ Agent for a widget and name the spreadsheet and range, for example Scorecard!A2:C5 in Weekly KPIs.
Your own Google Sheets or the whole workspace
Google Sheets can be connected twice on one card. The Company connection, made by an owner or admin, is for shared sheets like the sales plan or the weekly scorecard, and only the person who connected it can choose its spreadsheets. Any member can also add Just for me with their own Google account and their own picked sheets, such as a personal pipeline tracker. Only that member can build widgets from it, though a widget they put on a shared screen keeps showing there.
Read-only. Google's drive.file permission limits Dance Party to the spreadsheets you picked, not your Drive. Google's wording mentions editing because that permission type covers it, but Dance Party only calls the Sheets read endpoints. Remove access in your Google Account under Security, Third-party apps and services, or click Disconnect on the card.
From Google Sheets to your office display
Once Google Sheets shows Connected, the rest happens in plain English. No code, no drag-and-drop.
1. Describe it. Tell DJ Agent what you want to see.
New dashboard+ WidgetDescribe a widget in DJ Agent, or click + WidgetDJ AgentDATA SOURCESGoogle SheetsConnectedShow progress to this month's revenue target from Plan!B4 in our 2026 Plan sheet, with the actual from Plan!C4.Send2. It gets built. The widget lands on your board with real Google Sheets data.
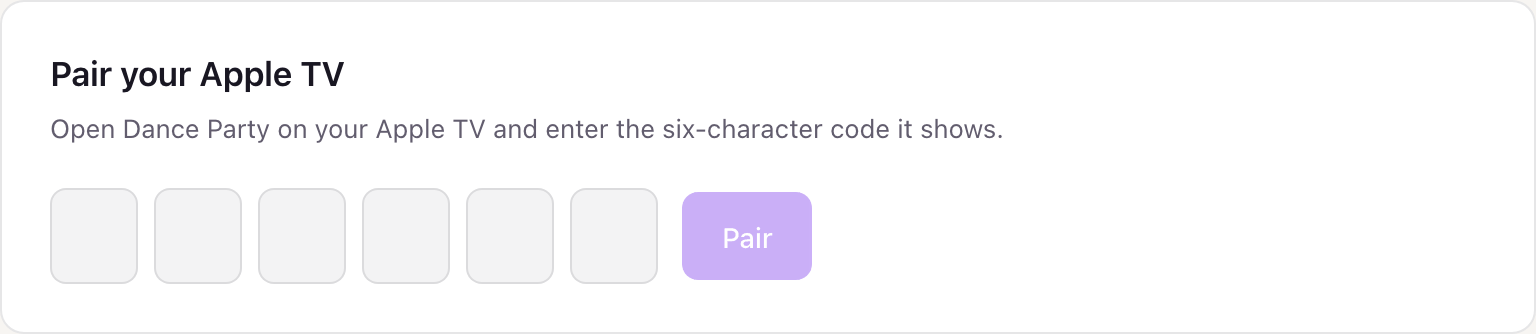
New dashboard+ WidgetSeptember revenue vs planLiveBooked this month$412K/ $500K82% to goalDJ AgentDATA SOURCESGoogle SheetsConnectedShow progress to this month's revenue target from Plan!B4 in our 2026 Plan sheet, with the actual from Plan!C4.Send3. Put it on a screen. Pair an Apple TV with the six-character code it shows, then assign the dashboard.
Google Sheets dashboard questions
Can I show a Google Sheet on a TV in the office?
Yes. Connect Google Sheets, pick the spreadsheet in Google's file picker, name the range, and DJ Agent builds a scorecard, chart or table for any screen running the Dance Party Apple TV app.
Can Dance Party see all of my Google Drive?
No. It only sees the spreadsheets you pick in Google's file picker. Every other file in your Drive stays invisible to it.
Why doesn't DJ Agent find my spreadsheet?
It has not been picked yet. Click Choose spreadsheets on the Google Sheets card, select the file, and ask again.
What is the difference between Connect for workspace and Connect (just for me)?
Who owns the connection. Connect for workspace is the company's, set up by an owner or admin for shared sheets. Connect (just for me) uses your own Google account, and only you can build widgets from it.
Does the dashboard update when someone edits the sheet?
Yes, at the next refresh. Widgets refresh on the interval you choose, hourly by default and as often as every 5 minutes.
Can I combine a Google Sheets target with numbers from another tool?
Yes. One widget can read a target cell from Sheets and the actual from a connected source like HubSpot or Stripe, and show progress between them.
Can Dance Party change my spreadsheet?
No. It only reads values and tab structure. It never writes, clears, formats or shares a cell or a file.
More integrations
Put Google Sheets on every office display
Connect Google Sheets, describe the dashboard, and it runs on an Apple TV, refreshing on its own.
Get Started