
Google Analytics 4 on the office display: GA4 dashboards for Apple TV
Google Analytics is where most teams check whether the launch, the newsletter or the ad spend moved anyone. Dance Party runs GA4 reports for you and puts them on an office display: users this week, traffic by channel, top pages and key events, on an Apple TV dashboard that refreshes on its own.
- Read-only
- OAuth connection
- One connection per workspace
Popular Google Analytics dashboards
What teams running Google Analytics put on the screen, and what you would ask DJ Agent to get it.
Traffic acquisition by channel
For marketing and growth teams
Every campaign claims the spike. GA4's default channel groups on the wall show whether this week's sessions came from Organic Search, Paid Social or the email that went out on Tuesday.
- Sessions by session default channel group
- Engaged sessions and engagement rate per channel
- Key events per channel
Ask DJ Agent“Show GA4 sessions by default channel group for the last 7 days as bars, with key events for each channel.”
Top pages this week
For content, SEO and product marketing
Writers rarely see which post is working until the monthly report. A ranked list of pages by views, straight from the Pages and screens data, shows it on day two.
- Views by page path or page title
- Active users per page
- Average engagement time per page
Ask DJ Agent“Rank our top 5 Google Analytics pages by views this week, using page title, with active users next to each.”
Key events against the monthly target
For the growth team and leadership
Traffic is a proxy. Key events are the sign-ups, demo requests and purchases you marked in GA4, and a goal bar on the wall keeps the month's real target in view.
- Key events month to date, for one event name or all of them
- Key events by event name
- Session key event rate
Ask DJ Agent“Show GA4 key events for sign_up this month against a target of 1,500.”
Every site in one portfolio view
For agencies and teams running several websites
If you run a product site, a docs site and a blog as separate GA4 properties, one widget can read up to ten of them side by side, so nobody flips between properties to compare.
- Active users for each GA4 property over the same window
- Sessions and key events per property
- Change against the previous period, per property
Ask DJ Agent“Compare active users over the last 28 days across our GA4 properties for the product site, docs, blog and help center.”
What Dance Party reads from Google Analytics
Dance Party reads Google Analytics 4 through Google's Analytics Data API and Admin API with read-only access. It runs standard GA4 reports on the properties your Google login can see and cannot change a property, a stream or a key event.
Accounts and properties
Google Analytics API docs ↗- Account summariesEvery GA4 account and property your Google login can access, with names and property IDs.
- Property metadataThe dimensions and metrics available on a property, including your custom ones.
Reports
Google Analytics API docs ↗- Users and sessionsActive users, new users, sessions, engaged sessions and engagement rate.
- AcquisitionSession default channel group, source, medium and campaign.
- Pages and screensViews, page path, page title and engagement time.
- Events and key eventsEvent counts by event name, key events and key event rate.
- AudienceCountry, city, device category, browser and other standard dimensions.
Portfolio reports
Google Analytics API docs ↗- Several properties at onceThe same report run on 2 to 10 GA4 properties and returned together, each with its own label.
How to connect Google Analytics
Before you start
- An owner or admin of your Dance Party workspace makes the Google Analytics connection.
- A Google account with at least the Viewer role on the GA4 properties you want to show
- GA4 properties. Universal Analytics properties cannot be read.
- 1Open Integrations in Dance Party and scroll to Google Analytics.
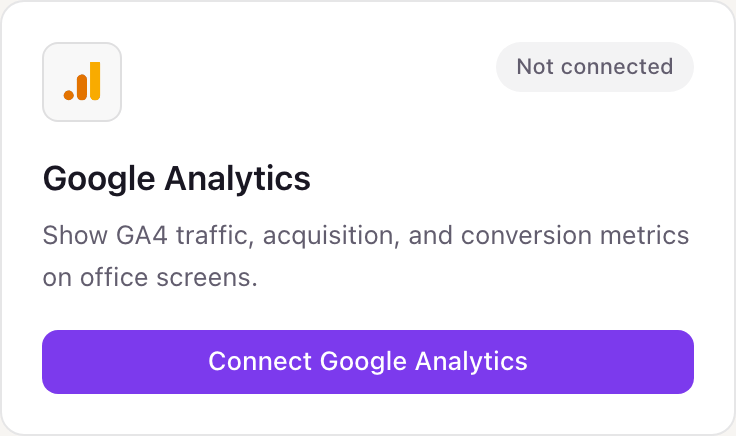
- 2Click Connect Google Analytics. Google asks you to choose the account to sign in with.
- 3Pick the Google account that has access to your GA4 properties, then allow Dance Party to see and download your Google Analytics data.
- 4Back on the Integrations page the card reads Connected, and DJ Agent can list your GA4 properties by name.
One Google Analytics connection per workspace
A workspace connects one Google login, but that login can reach every GA4 property it has access to, across accounts. A single widget can compare up to ten of those properties. To add a property from a different Google login, give the connected login Viewer access to it in GA4.
Read-only. Dance Party asks Google for the analytics.readonly scope, which can run reports but cannot edit properties, data streams or key events. Remove access any time from your Google Account's third-party connections page.
From Google Analytics to your office display
Once Google Analytics shows Connected, the rest happens in plain English. No code, no drag-and-drop.
1. Describe it. Tell DJ Agent what you want to see.
New dashboard+ WidgetDescribe a widget in DJ Agent, or click + WidgetDJ AgentDATA SOURCESGoogle AnalyticsConnectedShow GA4 sessions by default channel group for the last 7 days as bars, with key events for each channel.Send2. It gets built. The widget lands on your board with real Google Analytics data.
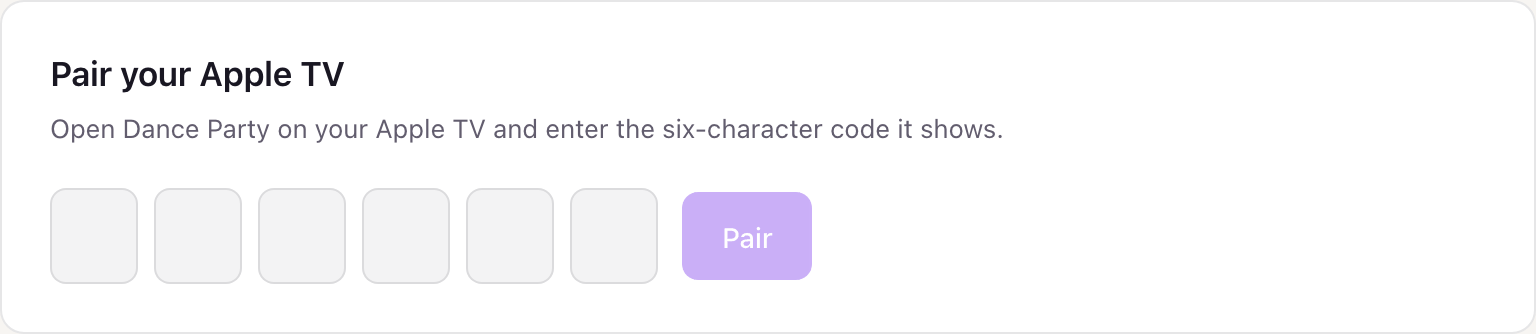
New dashboard+ WidgetSessions by channel, last 7 daysLive17,340sessionsOrganic SearchDirectPaid SocialReferralEmailOrganic SocialDJ AgentDATA SOURCESGoogle AnalyticsConnectedShow GA4 sessions by default channel group for the last 7 days as bars, with key events for each channel.Send3. Put it on a screen. Pair an Apple TV with the six-character code it shows, then assign the dashboard.
Google Analytics dashboard questions
Can I put a GA4 dashboard on an Apple TV?
Yes. Connect Google Analytics, describe the report you want, and assign the dashboard to a screen. The Dance Party Apple TV app shows it and refreshes it on the schedule you pick.
Can one dashboard show several Google Analytics properties?
Yes. One widget can run the same GA4 report across 2 to 10 properties and show them side by side, as long as the connected Google login can see each one.
Does it show GA4 realtime users?
No. Dance Party runs standard GA4 reports, which include today as Google processes it. It does not read the Realtime report.
What Google Analytics access do I need?
Viewer on the property is enough. Dance Party only runs reports, so it never needs Editor or Administrator access.
Does it work with Universal Analytics?
No. Google retired Universal Analytics, and the Data API that Dance Party uses reads GA4 properties only.
Can I use my custom dimensions and key events?
Yes. Dance Party reads each property's metadata, so custom dimensions, custom metrics and the events you marked as key events are available to DJ Agent.
Can Dance Party change my Google Analytics setup?
No. The connection is read-only. It cannot edit properties, data streams, audiences or key events.
More integrations
Put Google Analytics on every office display
Connect Google Analytics, describe the dashboard, and it runs on an Apple TV, refreshing on its own.
Get Started