
Supabase project health on an Apple TV dashboard
A Supabase project is several services behind one URL: Postgres, Auth, the REST API, Realtime, and Storage. Dance Party checks each one and puts the result on an office display with database disk and API request volume, as a Supabase dashboard running on Apple TV.
- Read-only
- API key connection
- One connection per workspace
Popular Supabase dashboards
What teams running Supabase put on the screen, and what you would ask DJ Agent to get it.
Supabase service health board
For backend and on-call engineers
When sign-ins start failing, the first question is whether Supabase Auth is having trouble or the app is. A tile per service, checked on every refresh, answers that from across the room.
- Status of the database, Auth, REST, Realtime, Storage, and the connection pooler
- Healthy, coming up, or unhealthy for each service
- The time of the check
Ask DJ Agent“Show a health tile for each service in our Supabase production project: database, auth, REST, realtime, storage, and pooler.”
Database disk headroom
For the engineer who owns the database
On Pro plans and up, Supabase grows the disk by 50% at 90% full, up to four times a day, and at 95% with no expansions left the database goes read-only. A gauge of used against provisioned disk shows the headroom before a bulk import finds the limit.
- Provisioned, used, and available bytes on the database disk
- Percent of the disk in use
- When Supabase measured it
Ask DJ Agent“Show disk usage for our Supabase production project as a gauge, used GB against provisioned GB, with the percent used.”
API traffic by service
For product and backend teams
Request counts split into REST, Auth, Storage, and Realtime show what the app leans on. A jump in Auth requests on launch day is good news. The same jump at 3 a.m. is worth a look.
- REST, Auth, Storage, and Realtime request counts per time bucket
- Totals over a window you pick, from 15 minutes to 7 days
- The timestamps Supabase reports for each bucket
Ask DJ Agent“Chart Supabase API requests per day over the last 7 days for our production project, split into REST, auth, storage, and realtime.”
Project inventory
For the platform lead or CTO
Supabase projects pile up: production, staging, a preview per feature, a prototype nobody paused. A list of every project with its region and status shows what is running and what is paused.
- Every project the token can see, with its region
- Status of each project, such as active or paused
- The organization each project belongs to
- When each project was created
Ask DJ Agent“List all our Supabase projects with organization, region, and status, paused projects last.”
What Dance Party reads from Supabase
Dance Party reads Supabase through the Management API with a personal access token, using GET requests only. It does not query your database tables, read your auth users, or list files in Storage.
Projects and organizations
Supabase API docs ↗- ProjectsName, region, status, organization, and created date for every project the token can see.
- OrganizationsThe organizations the token belongs to.
Service health
Supabase API docs ↗- Service statusHealthy, coming up, or unhealthy for the database, Auth, REST, Realtime, Storage, and pooler, as of the check.
Database disk
Supabase API docs ↗- Disk utilizationProvisioned, used, and available bytes on the database disk, with Supabase's own timestamp. Not Storage bucket size.
API usage
Supabase API docs ↗- Requests by serviceREST, Auth, Storage, and Realtime request counts over 15 minutes to 7 days, bucket by bucket.
How to connect Supabase
Before you start
- An owner or admin of your Dance Party workspace makes the Supabase connection.
- A Supabase account with a role on the organization or project you want to show
- A personal access token. A scoped token limited to that organization or project with read access is the safer choice; a classic token reaches every organization on your account.
- Optional: the project ref of the project most screens should show
- 1In the Integrations list in Dance Party, click Connect Supabase.
- 2Open Supabase's Access Tokens page and generate a new token, limited to the organization or project the screen should show, with read access.Create a Supabase access token ↗
- 3Copy the token into Personal access token. Supabase shows it once.
- 4To set a default project, paste its ref into Project ref. It is the 20-character ID in your dashboard address, right after /project/.
- 5Click Save. Dance Party reads your Supabase profile to check the token, and the card shows Connected.
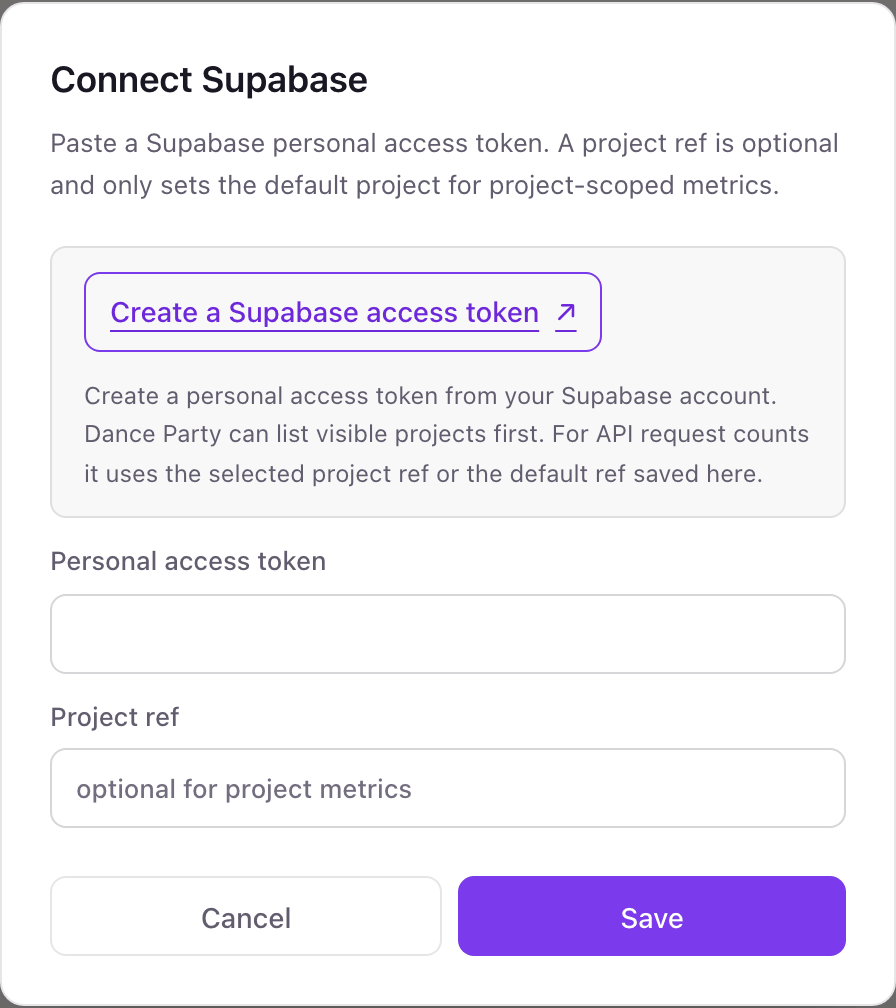
One Supabase connection per workspace
A workspace holds one Supabase token, and that token can see every project it is scoped to. Set a default project ref for the usual screen, and name any other project in the prompt to put it on a different widget.
Read-only in use. Dance Party only calls Management API GET endpoints for your profile, organizations, projects, health, disk, and usage, and a scoped token narrows what it could reach. Revoke the token on Supabase's Access Tokens page to cut access.
From Supabase to your office display
Once Supabase shows Connected, the rest happens in plain English. No code, no drag-and-drop.
1. Describe it. Tell DJ Agent what you want to see.
New dashboard+ WidgetDescribe a widget in DJ Agent, or click + WidgetDJ AgentDATA SOURCESSupabaseConnectedShow a health tile for each service in our Supabase production project: database, auth, REST, realtime, storage, and pooler.Send2. It gets built. The widget lands on your board with real Supabase data.
New dashboard+ Widgetprod-app servicesLiveDatabaseHealthyAuthHealthyRESTHealthyRealtimeHealthyStorageHealthyPoolerComing upDJ AgentDATA SOURCESSupabaseConnectedShow a health tile for each service in our Supabase production project: database, auth, REST, realtime, storage, and pooler.Send3. Put it on a screen. Pair an Apple TV with the six-character code it shows, then assign the dashboard.

Supabase dashboard questions
Can I show Supabase project health on an Apple TV?
Yes. Connect Supabase with a personal access token, ask DJ Agent for a service health board, and assign it to a screen running the Dance Party Apple TV app.
Is the Supabase health tile an uptime history?
No. Each refresh is a point-in-time check of each service. Dance Party shows the result with the time of the check and does not rebuild uptime history from it.
Does Dance Party read my Supabase tables or users?
No. It uses the Management API, not your database. It reads project status, health, disk, and API usage, never rows, auth users, or Storage files.
Is database disk the same as Storage usage?
No. Disk utilization is the Postgres database disk. The size of files in Supabase Storage buckets is not read.
Can it show how many users signed up for my app?
No. Auth request counts are API calls, not users, and counting signups would mean querying your database, which Dance Party does not do.
Can one connection show several Supabase projects?
Yes. The token can see every project it is scoped to. Each widget names its project, and the Project ref you saved is the default.
More integrations
Put Supabase on every office display
Connect Supabase, describe the dashboard, and it runs on an Apple TV, refreshing on its own.
Get Started