
A Datadog dashboard for the engineering floor's Apple TV
The first question on any Datadog shift is how many monitors are not OK right now. Dance Party answers it on the office display, next to active incidents and SLO error budgets, as a Datadog dashboard you describe in one sentence and run on Apple TV.
- Read-only
- API key connection
- One connection per workspace
Datadog dashboard examples
What teams running Datadog put on the screen, and what you would ask DJ Agent to get it.
Alerting monitors wall
For SRE and the on-call engineer
Manage Monitors only tells the person who has it open. On the wall, a monitor that flips to Alert or goes No Data is seen by the whole team within one refresh, and No Data gets its own row instead of hiding inside OK.
- Monitors in OK, Alert, Warn, and No Data
- Each monitor that is not OK, with its type and when it last triggered
- Total monitors in the org
Ask DJ Agent“Show our Datadog monitors that are not OK, Alert first, with the monitor type and when each one last triggered.”
Active incident board
For incident commanders and support leads
Once an incident is declared in Datadog, everyone in the room should know its SEV level without asking in Slack. The board counts active incidents by severity and flags the ones marked customer impacted.
- Active incidents by severity, SEV-1 to SEV-5
- Title of each incident and when it was detected
- Whether an incident is marked customer impacted
Ask DJ Agent“Show active Datadog incidents by severity, and flag any incident marked customer impacted with its title and detection time.”
SLO error budget tracker
For platform and product engineering leads
A 99.9% SLO over 30 days leaves about 43 minutes of budget. Budget remaining per SLO tells the team whether this is a week to ship features or a week to pay down reliability work.
- Current SLI against the target for each SLO
- Error budget remaining per SLO and timeframe
- SLOs in ok, warning, and breached state
Ask DJ Agent“Show each Datadog SLO with its 30-day SLI and error budget remaining, and highlight any SLO in warning or breached.”
Production traffic sparkline
For the engineering team
One metric the team already graphs, drawn big enough to read from the kitchen. A dip in production request volume right after a deploy is obvious at a glance, well before a monitor threshold trips.
- Any Datadog metric by name, as avg, sum, min, or max
- Filtered by up to five tags, such as env:prod or service:web
- Latest, minimum, maximum, and average over 1 to 30 days
- Active and reporting host totals
Ask DJ Agent“Chart the Datadog metric trace.http.request.hits summed for env:prod over the last 24 hours, with the latest value and the day's peak.”
What Dance Party reads from Datadog
Dance Party reads Datadog with your API key and an application key scoped to five read permissions. Every request is a GET. It cannot mute a monitor, schedule a downtime, edit an SLO, or submit a metric.
Monitors
Datadog API docs ↗- Monitor statesTotals for OK, Alert, Warn, and No Data across every monitor in the org.
- Alerting monitorsUp to 100 monitors that are not OK, with name, type, state, and last triggered time.
Incidents
Datadog API docs ↗- Active incidentsTitle, severity, state, customer impact, and created and detected times. Responder names are left out.
- Severity countsHow many active incidents sit at each SEV level.
Metrics
Datadog API docs ↗- Metric timeseriesOne metric by name over 1 to 30 days, up to 200 points, with the tags you choose.
- Window summaryThe latest value plus the minimum, maximum, and average over the window.
Service level objectives
Datadog API docs ↗- SLO statusTarget, current SLI, error budget remaining, and state for each SLO and timeframe.
Hosts
Datadog API docs ↗- Host totalsActive hosts and hosts reporting in the last two hours.
How to connect Datadog
Before you start
- An owner or admin of your Dance Party workspace makes the Datadog connection.
- A Datadog API key, created under Organization Settings, API Keys (Datadog Admins can create one)
- A Datadog application key with exactly five scopes: monitors_read, incident_read, timeseries_query, slos_read, and hosts_read. A service account is the better owner, since a disabled user's keys are revoked.
- Your Datadog site: US1, US3, US5, EU1, AP1, AP2, UK1, US1-FED, or US2-FED
- Datadog Incident Management for the active incidents read. Monitors, metrics, SLOs, and hosts work on any plan, including Free.
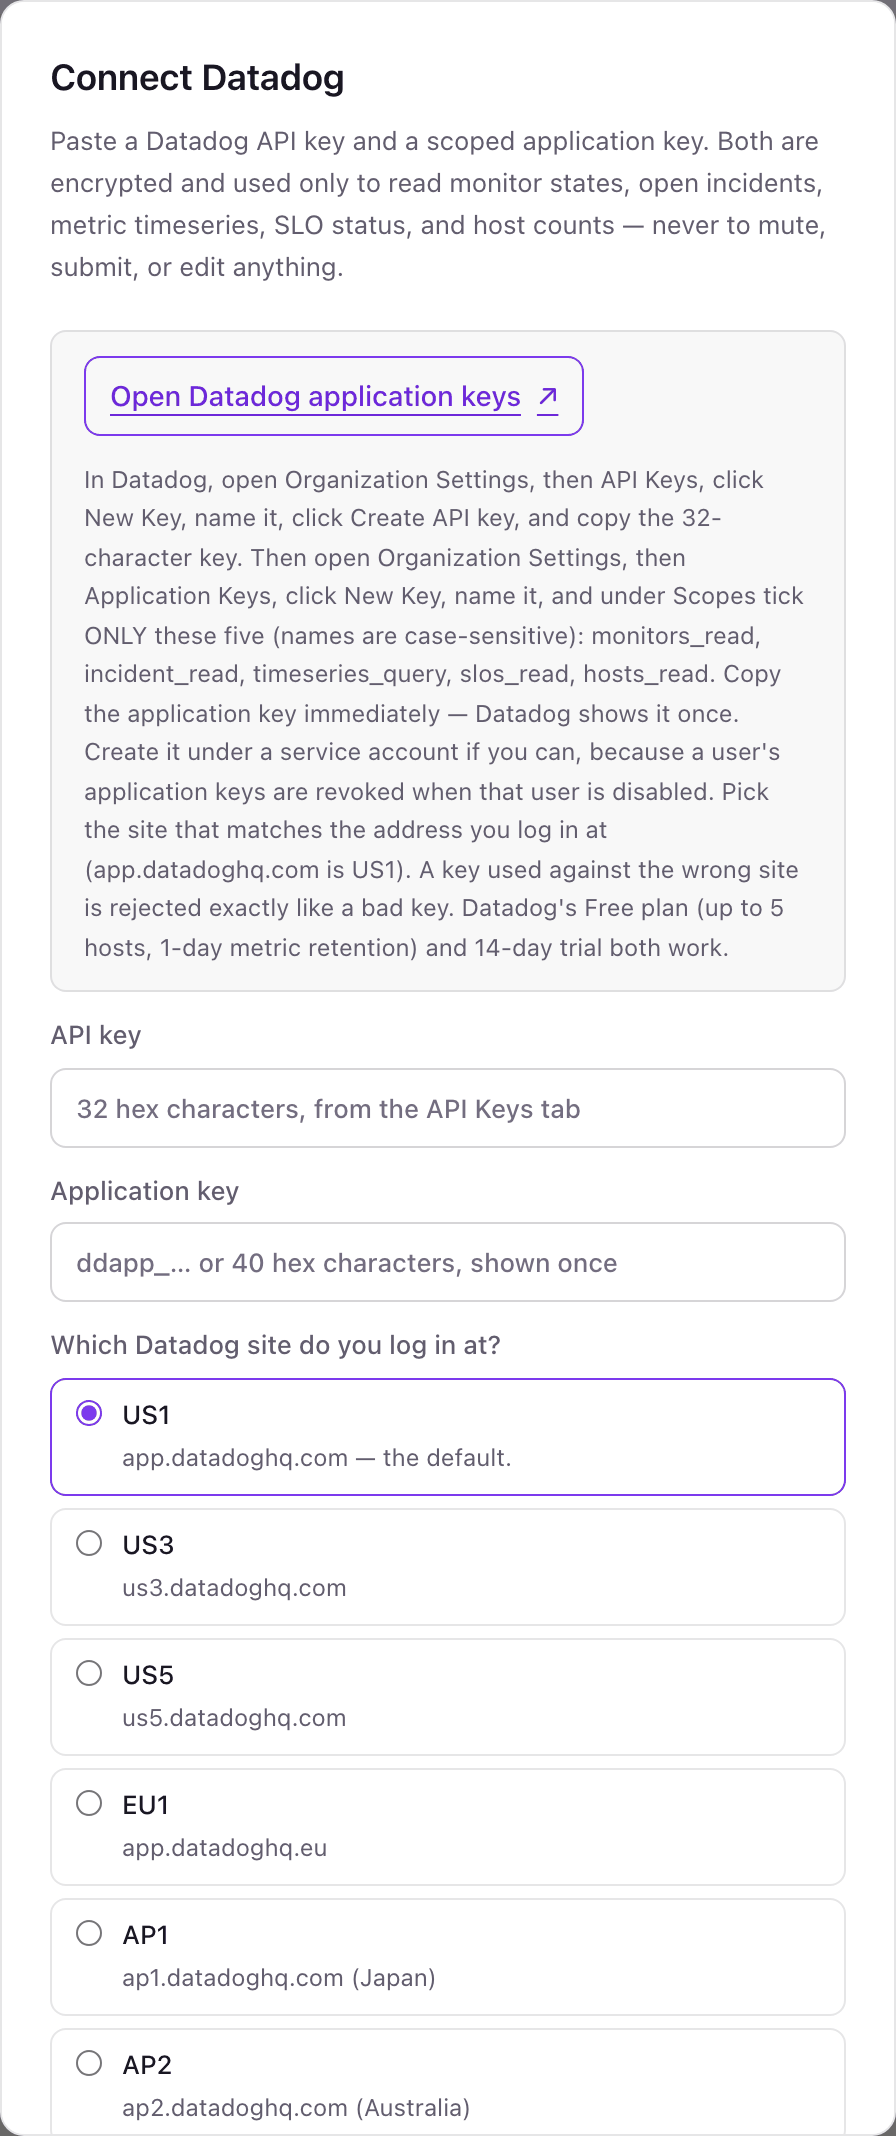
- 1Head to Integrations in Dance Party and click Connect Datadog. The pop-up asks for two keys and a site.
- 2In Datadog, open Organization Settings, then API Keys. Click New Key, name it Dance Party, click Create API key, and paste the 32-character key into API key.Open Datadog API keys (US1) ↗
- 3Open Application Keys and click New Key. Under Scopes tick only monitors_read, incident_read, timeseries_query, slos_read, and hosts_read, then paste the key into Application key. Datadog shows it once.Open Datadog application keys (US1) ↗
- 4Under Which Datadog site do you log in at?, pick the site in your Datadog address bar. app.datadoghq.com is US1 and app.datadoghq.eu is EU1.
- 5Click Save. Dance Party reads your host totals to prove both keys and the site, and the card shows Connected.
One Datadog connection per workspace
A workspace connects one Datadog org on one site. A company that runs a separate EU org alongside its US org needs a second Dance Party workspace for the other one.
Read-only by scope. The application key can only do what its five read scopes allow, and Dance Party sends nothing but GET requests with it. To cut access, revoke the Dance Party application key under Organization Settings, Application Keys.
From Datadog to your office display
Once Datadog shows Connected, the rest happens in plain English. No code, no drag-and-drop.
1. Describe it. Tell DJ Agent what you want to see.
New dashboard+ WidgetDescribe a widget in DJ Agent, or click + WidgetDJ AgentDATA SOURCESDatadogConnectedShow our Datadog monitors that are not OK, Alert first, with the monitor type and when each one last triggered.Send2. It gets built. The widget lands on your board with real Datadog data.
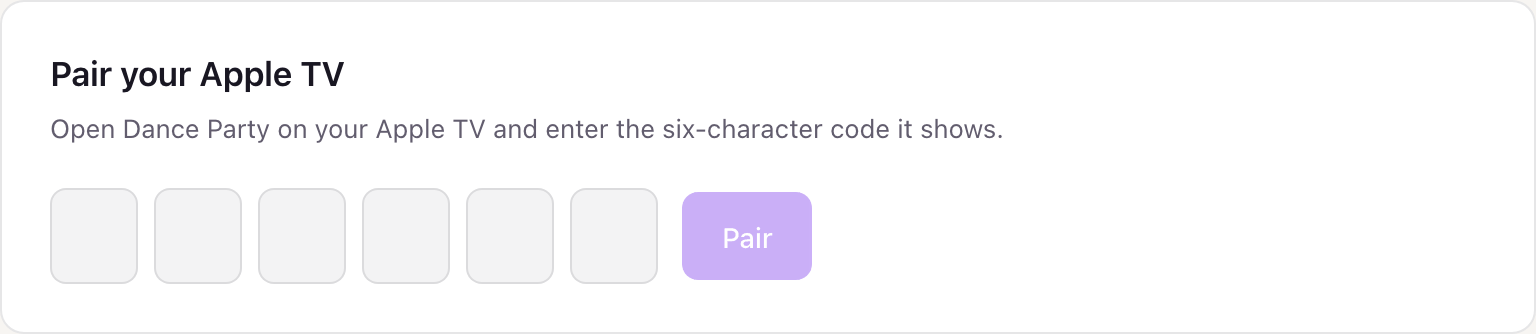
New dashboard+ WidgetAlerting nowLiveAlertcheckout-api p99 latency above 1.2smetric alert, triggered 14 min agoWarnpayments-worker queue depthquery alert, triggered 38 min agoWarndb-replica-2 disk usagemetric alert, triggered 2 h agoNo Dataedge-proxy process checkservice check, silent for 1 hDJ AgentDATA SOURCESDatadogConnectedShow our Datadog monitors that are not OK, Alert first, with the monitor type and when each one last triggered.Send3. Put it on a screen. Pair an Apple TV with the six-character code it shows, then assign the dashboard.
Datadog dashboard questions
Can I put a Datadog dashboard on an Apple TV?
Yes. Connect Datadog with an API key and a scoped application key, describe the board to DJ Agent, and assign it to a screen running the Dance Party Apple TV app.
How is this different from Datadog's TV mode?
TV mode shows one Datadog dashboard full screen in a web browser. Dance Party runs as an Apple TV app, and a screen can mix Datadog widgets with widgets from PagerDuty, Sentry, or your other connected tools.
Which Datadog application key scopes does Dance Party need?
Five: monitors_read, incident_read, timeseries_query, slos_read, and hosts_read. Scope names are case-sensitive, and nothing else is needed.
Why does Datadog reject my keys?
Usually the site. Datadog answers a key used on the wrong site with the same 403 as a bad key, so check that the site you picked matches the address you log in at.
Does it work on the Datadog Free plan?
Yes. The Free plan and the 14-day trial both work for monitors, metrics, SLOs, and hosts. Active incidents need Datadog Incident Management.
Can Dance Party mute monitors or change anything in Datadog?
No. The application key only carries read scopes, and Dance Party only sends GET requests. It cannot mute, schedule downtime, declare incidents, or edit SLOs.
How often does a Datadog widget refresh?
As often as every 5 minutes, the fastest refresh Dance Party offers. Each refresh is one or two requests, which stays well inside Datadog's per-endpoint rate limits.
More integrations
Put Datadog on every office display
Connect Datadog, describe the dashboard, and it runs on an Apple TV, refreshing on its own.
Get Started