
Linear cycles and projects on an Apple TV dashboard in the office
Linear is built around cycles and projects, and its progress numbers are the ones product teams quote in every review. Dance Party reads them with read-only access and puts them on an Apple TV dashboard on the office display: each team's current cycle, which projects are near their target date, and the urgent issues nobody has picked up.
- Read-only
- OAuth connection
- One connection per workspace
Popular Linear dashboards
What teams running Linear put on the screen, and what you would ask DJ Agent to get it.
Current cycle by team
For engineering managers and every team in the room
Each Linear team runs its own cycle, and nobody sees the others. Every team's active cycle progress in one ranked list shows on Wednesday which one is going to carry work into the next cycle.
- Progress of each team's active cycle
- Cycle number and end date
- Issues in the cycle by state: backlog, started, completed
Ask DJ Agent“Rank our Linear teams by progress in their active cycle, with each cycle number and end date.”
Projects and target dates
For product, design, and leadership
Linear projects carry a target date and a progress number, which is most of what a roadmap review covers. Started projects sorted by target date, with the ones behind pace in amber, keep the roadmap honest between reviews.
- Started projects with progress and target date
- Project lead and the teams working on it
- Projects past their target date that are not completed
Ask DJ Agent“List started Linear projects by target date with progress and lead, and flag any past its target date.”
Triage and urgent issues
For on-call engineers and team leads
Linear's Urgent priority means drop everything, and it should not sit in Triage. Counts of urgent and high-priority open issues, next to what is waiting in Triage, keep the loudest work visible to the whole team.
- Open issues with Urgent priority
- Open issues with High priority
- Issues waiting in Triage
- Issues in review
Ask DJ Agent“Count open Linear issues that are Urgent, High priority, in Triage, and In Review for the Platform team.”
What Dance Party reads from Linear
Dance Party reads Linear through its GraphQL API with the read scope, as the Linear user who connected. It sees the teams, projects, cycles, and issues that user can see, and cannot create or change any of them.
Issues
Linear API docs ↗- IssuesIdentifier, title, state, priority, estimate, assignee, labels, cycle, project, due date, and completed date. Up to 50 per query, filtered by any of those.
Cycles and projects
Linear API docs ↗- CyclesNumber, name, start and end dates, completion, and progress for each team's cycles.
- ProjectsState, progress, start and target dates, lead, and teams.
Teams
Linear API docs ↗- TeamsTeam key, name, and issue count.
- Connected userWhich Linear account the connection belongs to.
How to connect Linear
Before you start
- An owner or admin of your Dance Party workspace makes the Linear connection.
- A Linear account in the workspace you want to show. Private teams appear only if that account is a member.
- No API key. Linear handles sign-in and asks for read access only.
- 1Find Linear on the Dance Party Integrations page.
- 2Click Connect Linear. Linear opens its authorization page.
- 3If you belong to more than one Linear workspace, pick the one to show, then approve read access.
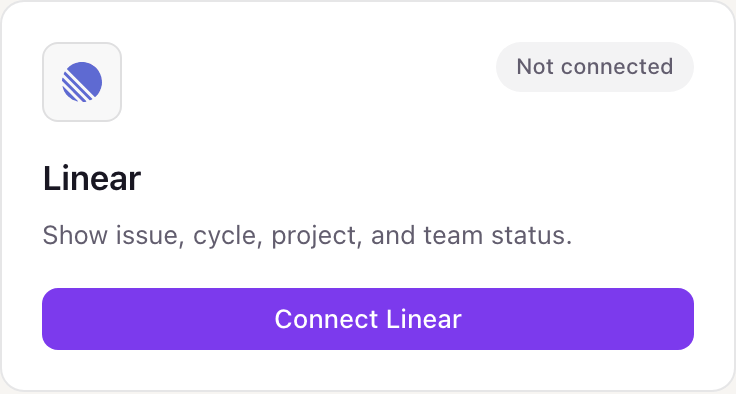
- 4Back in Dance Party, the Linear card now reads Connected.
One Linear connection per workspace
A workspace connects one Linear workspace through one person's sign-in. Dashboards see what that person sees in Linear, so connect with an account that is on every team you want on screen.
Read-only. Dance Party requests Linear's read scope, which cannot create, edit, or delete anything. Revoke it from your Linear account settings under Security and access, or disconnect from the Integrations page.
From Linear to your office display
Once Linear shows Connected, the rest happens in plain English. No code, no drag-and-drop.
1. Describe it. Tell DJ Agent what you want to see.
New dashboard+ WidgetDescribe a widget in DJ Agent, or click + WidgetDJ AgentDATA SOURCESLinearConnectedRank our Linear teams by progress in their active cycle, with each cycle number and end date.Send2. It gets built. The widget lands on your board with real Linear data.
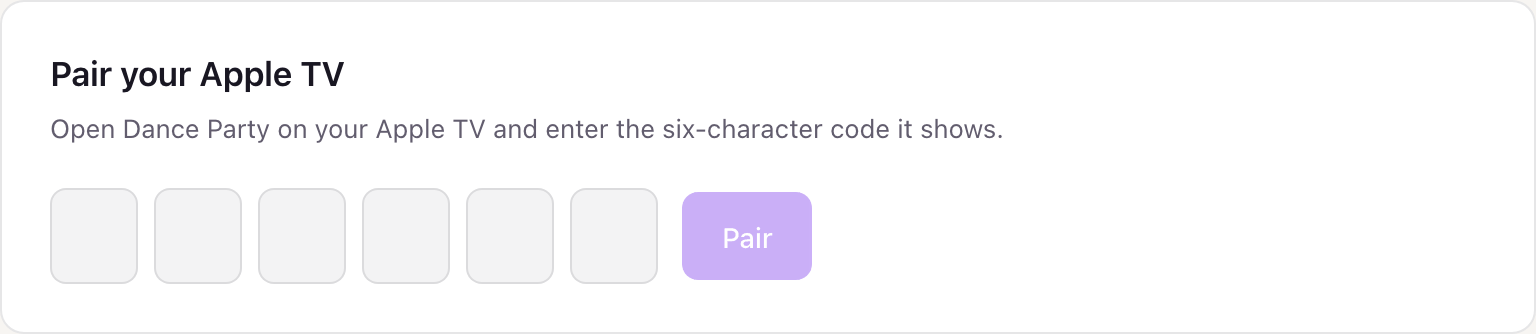
New dashboard+ WidgetActive cyclesLive1Platform, Cycle 3868%2Growth, Cycle 2254%3Mobile, Cycle 1547%4Design Systems, Cycle 931%DJ AgentDATA SOURCESLinearConnectedRank our Linear teams by progress in their active cycle, with each cycle number and end date.Send3. Put it on a screen. Pair an Apple TV with the six-character code it shows, then assign the dashboard.
Linear dashboard questions
Can I show a Linear cycle on a TV in the office?
Yes. Connect Linear, ask for the active cycle of a team, and assign the dashboard to an Apple TV running Dance Party. It refreshes on its own.
Does the progress match what Linear shows?
Yes. Dance Party reads the progress Linear calculates for each cycle and project, so the number on the screen is Linear's own.
Can I show several Linear teams on one screen?
Yes. One connection covers every team the connecting user can see, and each widget can show a different team or all of them.
Can it show a burn-up chart or cycle velocity?
No. Dance Party reads current cycle progress and issues, not the history behind Linear's charts.
Does Linear need an API key for Dance Party?
No. You sign in to Linear and approve read access. There is no personal API key to create or paste.
Can Dance Party create or move Linear issues?
No. The read scope cannot write. It cannot create issues, change states, or edit projects or cycles.
More integrations
Put Linear on every office display
Connect Linear, describe the dashboard, and it runs on an Apple TV, refreshing on its own.
Get Started