
ChartMogul MRR and churn dashboards, always on an Apple TV office display
ChartMogul already does the hard part of SaaS metrics: it merges Stripe, Chargebee, Paddle, and your other billing sources into one set of MRR, ARR, and churn numbers. Dance Party puts those numbers on the office display, so the whole team sees the ChartMogul dashboard the founders check every morning, running on an Apple TV.
- Read-only
- API key connection
- One connection per workspace
Popular ChartMogul dashboards
What teams running ChartMogul put on the screen, and what you would ask DJ Agent to get it.
SaaS metrics wall
For the founders, leadership, and the board-meeting crowd
These are the four numbers every SaaS board deck opens with. Showing them the way ChartMogul calculates them means the screen and the investor update never disagree.
- MRR and ARR, current month
- Customer churn rate
- ARPA, average revenue per account
- Customer count
Ask DJ Agent“Show ChartMogul MRR, ARR, customer churn rate, and ARPA for this month, each with the change from last month.”
Road to the ARR target
For the whole company
An annual ARR target is the goal most SaaS teams are measured on, and it rarely appears anywhere but a planning doc. A progress bar on the wall makes it a number people talk about.
- ARR today from ChartMogul
- Progress toward the year's ARR target
- ARR change over the last month
Ask DJ Agent“Show ChartMogul ARR as progress toward our $7M ARR target for the year.”
Customer growth by month
For growth, marketing, and customer success
MRR can rise on a few big upgrades while the customer base stalls. The customer count by month shows whether the business is adding accounts, not only dollars.
- Customers at the end of each month
- Month-over-month change in customers
- Customer count today
Ask DJ Agent“Chart ChartMogul customer count by month for the last 6 months, with today's count as the headline.”
Net MRR churn watch
For customer success and the head of revenue
Net MRR churn is where expansion either covers lost revenue or does not. Watching it month by month tells customer success whether their saves and upsells are actually outrunning cancellations.
- Net MRR churn rate by month
- Customer churn rate by month
- LTV, customer lifetime value
Ask DJ Agent“Show ChartMogul net MRR churn rate by month for the last year, with customer churn rate and LTV beside it.”
What Dance Party reads from ChartMogul
Dance Party reads ChartMogul's metrics API with your API key, so every number matches what ChartMogul shows. Money arrives in your account currency, over any date range, by day, week, month, quarter, or year.
Key metrics
ChartMogul API docs ↗- MRR and ARRRecurring revenue for each period in the range.
- Churn ratesCustomer churn rate and net MRR churn rate.
- ARPA, ASP, and LTVAverage revenue per account, average sale price, and customer lifetime value.
- CustomersPaying customers in each period.
Trends
ChartMogul API docs ↗- MRR seriesMRR per period with the current value, previous value, and percentage change.
- ARR seriesThe same shape for ARR.
- Customer count seriesCustomers per period with the change from the previous period.
Customers
ChartMogul API docs ↗- Customer listName, current MRR, and status, one page of up to 200 customers, optionally filtered by status.
How to connect ChartMogul
Before you start
- An owner or admin of your Dance Party workspace makes the ChartMogul connection.
- A ChartMogul API key. A Read-only access level is enough.
- Staff, Admin, and Owner roles in ChartMogul choose the access level when they create a key. Pick Read-only.
- 1In ChartMogul, open Profile, then your name, then Your Account, API keys, and click Add API Key.Open ChartMogul API keys ↗
- 2Name the key Dance Party, set Access Level to Read-only, and click Add. Copy the key.
- 3In Dance Party, click Connect ChartMogul and paste the key into API key.
- 4Click Connect. Dance Party pings ChartMogul to check the key, and the card shows Connected.
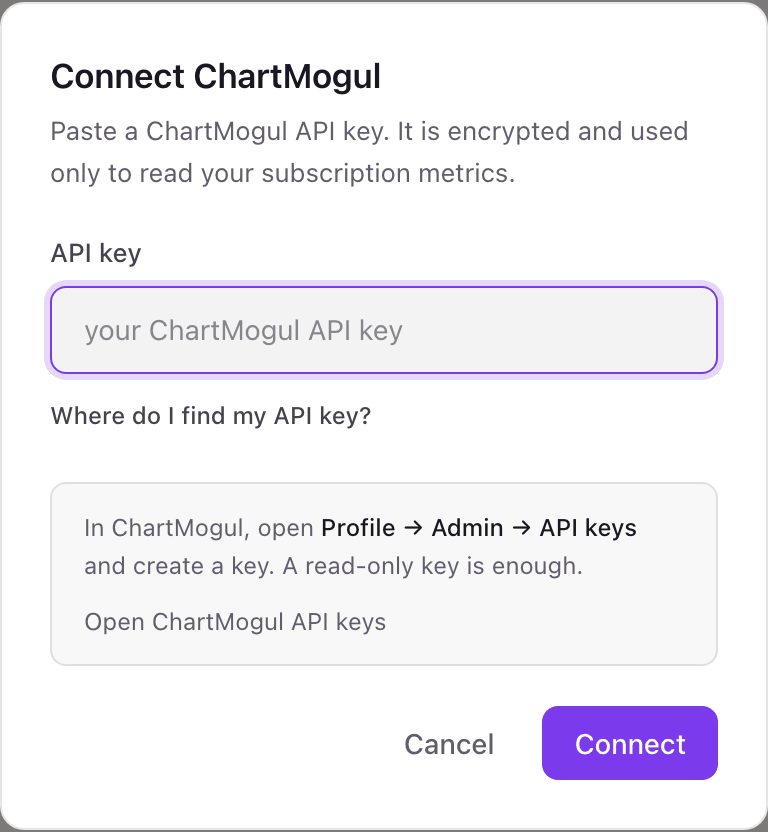
One ChartMogul connection per workspace
One ChartMogul account per workspace. ChartMogul already combines every billing source you import into one set of metrics, so a single key covers Stripe, Chargebee, Paddle, and the rest together.
A Read-only ChartMogul key cannot import data, edit customers, or change plans. Dance Party only reads metrics and the customer list with it. Delete the key from your ChartMogul API keys page to cut access.
From ChartMogul to your office display
Once ChartMogul shows Connected, the rest happens in plain English. No code, no drag-and-drop.
1. Describe it. Tell DJ Agent what you want to see.
New dashboard+ WidgetDescribe a widget in DJ Agent, or click + WidgetDJ AgentDATA SOURCESChartMogulConnectedShow ChartMogul MRR, ARR, customer churn rate, and ARPA for this month, each with the change from last month.Send2. It gets built. The widget lands on your board with real ChartMogul data.
New dashboard+ WidgetThis month in ChartMogulLiveMRR$486,200+3.8%ARR$5.83M+3.8%Customer churn1.9%-0.3 ptsARPA$412+1.2%DJ AgentDATA SOURCESChartMogulConnectedShow ChartMogul MRR, ARR, customer churn rate, and ARPA for this month, each with the change from last month.Send3. Put it on a screen. Pair an Apple TV with the six-character code it shows, then assign the dashboard.

ChartMogul dashboard questions
Can I show ChartMogul MRR on a TV in the office?
Yes. Connect ChartMogul, ask DJ Agent for the dashboard, and assign it to an Apple TV running Dance Party.
Will the numbers match what ChartMogul shows?
Yes. Dance Party reads ChartMogul's own metrics endpoints, so MRR, ARR, churn, and ARPA use ChartMogul's calculations, not a second version.
Can it show MRR movements like new, expansion, and churned MRR?
Not today. Dance Party reads total MRR, ARR, churn rates, ARPA, LTV, and customer counts. The new, expansion, contraction, and churn breakdown is not part of the connection yet.
Does it cover all of my billing systems?
Yes, if they are in ChartMogul. ChartMogul merges Stripe, Chargebee, Paddle, and other sources, and Dance Party reads the combined metrics.
Does the ChartMogul key need write access?
No. A Read-only key is enough, and Dance Party never writes to ChartMogul.
Can I show a list of my biggest customers?
Yes, with a limit. Dance Party reads one page of up to 200 customers with their MRR and status, so for larger customer bases the list covers the first 200 returned.
More integrations
Put ChartMogul on every office display
Connect ChartMogul, describe the dashboard, and it runs on an Apple TV, refreshing on its own.
Get Started