
Amplitude active users and saved charts, as an Apple TV dashboard on the office display
Amplitude counts what people do inside your product: who signed up, who came back, who clicked the new feature. Dance Party puts those counts on an office display, from daily active users to a saved Amplitude chart, as an Apple TV dashboard your product team walks past all day.
- Read-only
- API key connection
- One connection per workspace
Amplitude dashboard examples
What teams running Amplitude put on the screen, and what you would ask DJ Agent to get it.
New users this week
For growth and marketing
Launches and campaigns promise sign-ups. Amplitude's new-user count, with the last full day next to the 30-day average and peak, says on Thursday whether the launch landed.
- New users on the last complete day
- Average and peak new users over the window
- New users by day, week or month
Ask DJ Agent“Show Amplitude new users per day for the last 30 days: yesterday, the 30-day average, the peak day, and today so far.”
Purchase Completed, day by day
For product and revenue teams
The event your business runs on deserves its own line. Totals or unique users for one Amplitude event per day make a pricing change or a broken checkout visible within a day.
- Daily totals for one named event
- Unique users who did that event in the window
- Average events per user
Ask DJ Agent“Chart the Amplitude event Purchase Completed as daily totals for the last 30 days, with unique purchasers for the period.”
Top Amplitude events this week
For product managers and engineers
The events list shows what people actually do in the product, ranked by this week's volume. A new feature's event climbing the ranking is the first sign it is being used.
- Events ranked by this week's total volume
- Hidden and deleted events left out
- The exact event names, ready for a trend widget
Ask DJ Agent“Rank our top 5 Amplitude events by this week's volume.”
A saved Amplitude chart on the wall
For analysts and product leadership
Your analysts already built the chart that matters, with its segments and filters. Dance Party reads that saved chart's results by its ID, so the office sees the same numbers as the Amplitude dashboard.
- The rows and columns of one saved chart
- Whatever segments and breakdowns the chart already has
- Up to 200 rows
Ask DJ Agent“Put our saved Amplitude chart 'Weekly purchasers by plan' on screen as bars. The chart ID is in its URL.”
What Dance Party reads from Amplitude
Dance Party reads one Amplitude project through Amplitude's Dashboard REST API. It is limited to four documented GET requests, so it cannot send events, edit charts or delete user data, even though Amplitude's key pair itself has no read-only mode.
Users
Amplitude API docs ↗- Active usersDaily, weekly or monthly active users over 1 to 90 days, with average and peak.
- New usersNew users for the same windows.
Events
Amplitude API docs ↗- Event totalsDaily totals, unique users or average per user for one event.
- Top eventsYour events ranked by this week's volume, from the events list.
Saved charts
Amplitude API docs ↗- Chart resultsThe results of one saved chart, by the chart ID in its URL, up to 200 rows.
How to connect Amplitude
Before you start
- An owner or admin of your Dance Party workspace makes the Amplitude connection.
- A Manager or Admin role in Amplitude, to open the organization's API Keys page
- The project API key and project secret key for the one project you want to show
- The data residency the project was created with, United States or European Union
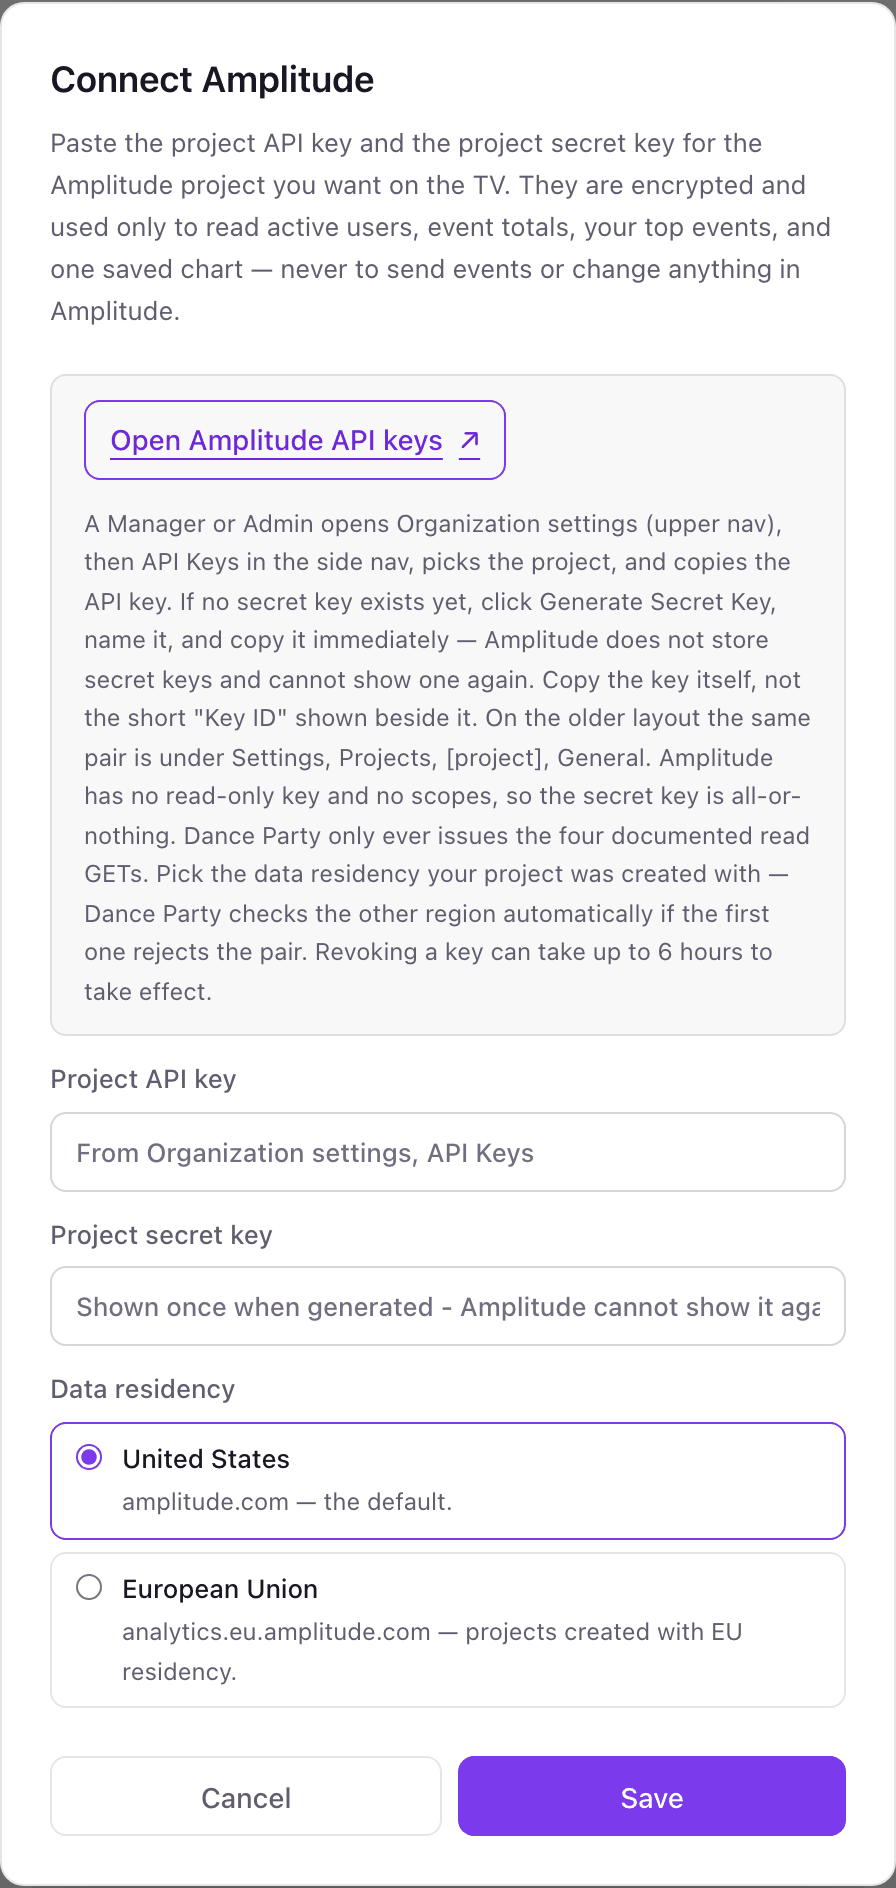
- 1In Amplitude, open Organization settings, then API Keys, and pick the project.Open Amplitude API keys ↗
- 2Copy the API key. If the project has no secret key yet, click Generate Secret Key, name it, and copy it right away. Copy the key itself, not the short Key ID beside it.
- 3In Dance Party, click Connect Amplitude and paste them into Project API key and Project secret key.
- 4Under Data residency choose United States or European Union, then click Save. If the first region rejects the pair, Dance Party tries the other one.
- 5The card shows Connected once Amplitude accepts the pair.
One Amplitude connection per workspace
A workspace connects one Amplitude project, because Amplitude keys belong to a single project. Teams with separate production and staging projects should connect production, and put another project in its own Dance Party workspace.
Amplitude secret keys cannot be limited to reading, so Dance Party limits itself: only four read requests exist in its Amplitude code. To revoke access, delete the secret key under Organization settings, API Keys. Amplitude says revocation can take up to 6 hours.
From Amplitude to your office display
Once Amplitude shows Connected, the rest happens in plain English. No code, no drag-and-drop.
1. Describe it. Tell DJ Agent what you want to see.
New dashboard+ WidgetDescribe a widget in DJ Agent, or click + WidgetDJ AgentDATA SOURCESAmplitudeConnectedShow Amplitude new users per day for the last 30 days: yesterday, the 30-day average, the peak day, and today so far.Send2. It gets built. The widget lands on your board with real Amplitude data.
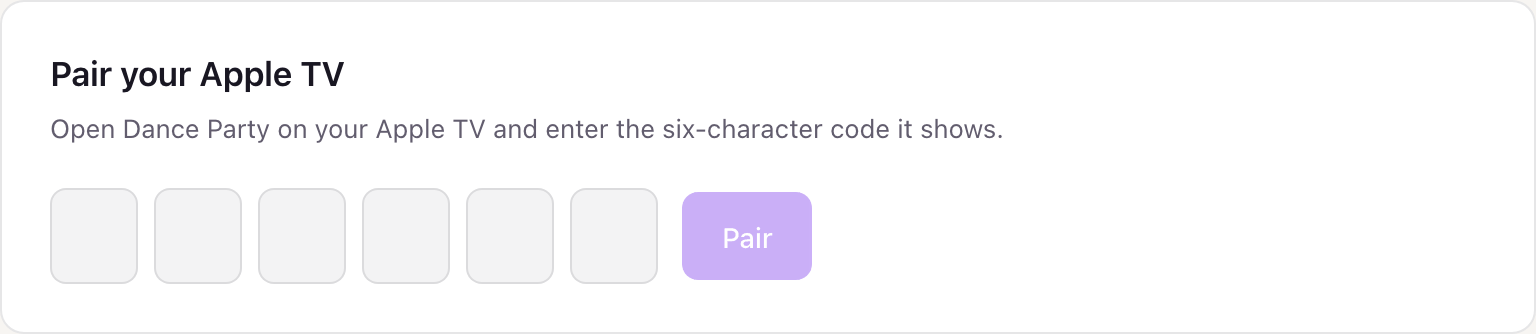
New dashboard+ WidgetAmplitude new usersLiveYesterday1,318+11%30-day average1,184Peak day2,046Today so far702DJ AgentDATA SOURCESAmplitudeConnectedShow Amplitude new users per day for the last 30 days: yesterday, the 30-day average, the peak day, and today so far.Send3. Put it on a screen. Pair an Apple TV with the six-character code it shows, then assign the dashboard.
Amplitude dashboard questions
Can I show Amplitude charts on an Apple TV?
Yes. Dance Party can read a saved Amplitude chart by its ID, or build active-user and event widgets, and show them on the Dance Party Apple TV app.
Why is the latest Amplitude day marked as so far?
Amplitude fills in recent data after the fact, so the last two days are partial. Dance Party labels them so far and headlines the last complete day.
Is there a read-only Amplitude API key?
No. Amplitude's project secret key has no scopes. Dance Party stays read-only because its Amplitude connector only contains four GET requests.
How do I find an Amplitude chart ID?
Open the chart in Amplitude and copy the ID from the address bar. Amplitude has no API that lists saved charts, so DJ Agent asks you for it.
Does it work with Amplitude EU data residency?
Yes. Choose European Union when you connect, and Dance Party reads from analytics.eu.amplitude.com.
Can I compare two Amplitude projects on one screen?
No, not from one workspace. A workspace connects one Amplitude project, since each key pair belongs to a single project.
More integrations
Put Amplitude on every office display
Connect Amplitude, describe the dashboard, and it runs on an Apple TV, refreshing on its own.
Get Started